repath – The Platform for Climate Resilient Infrastructure
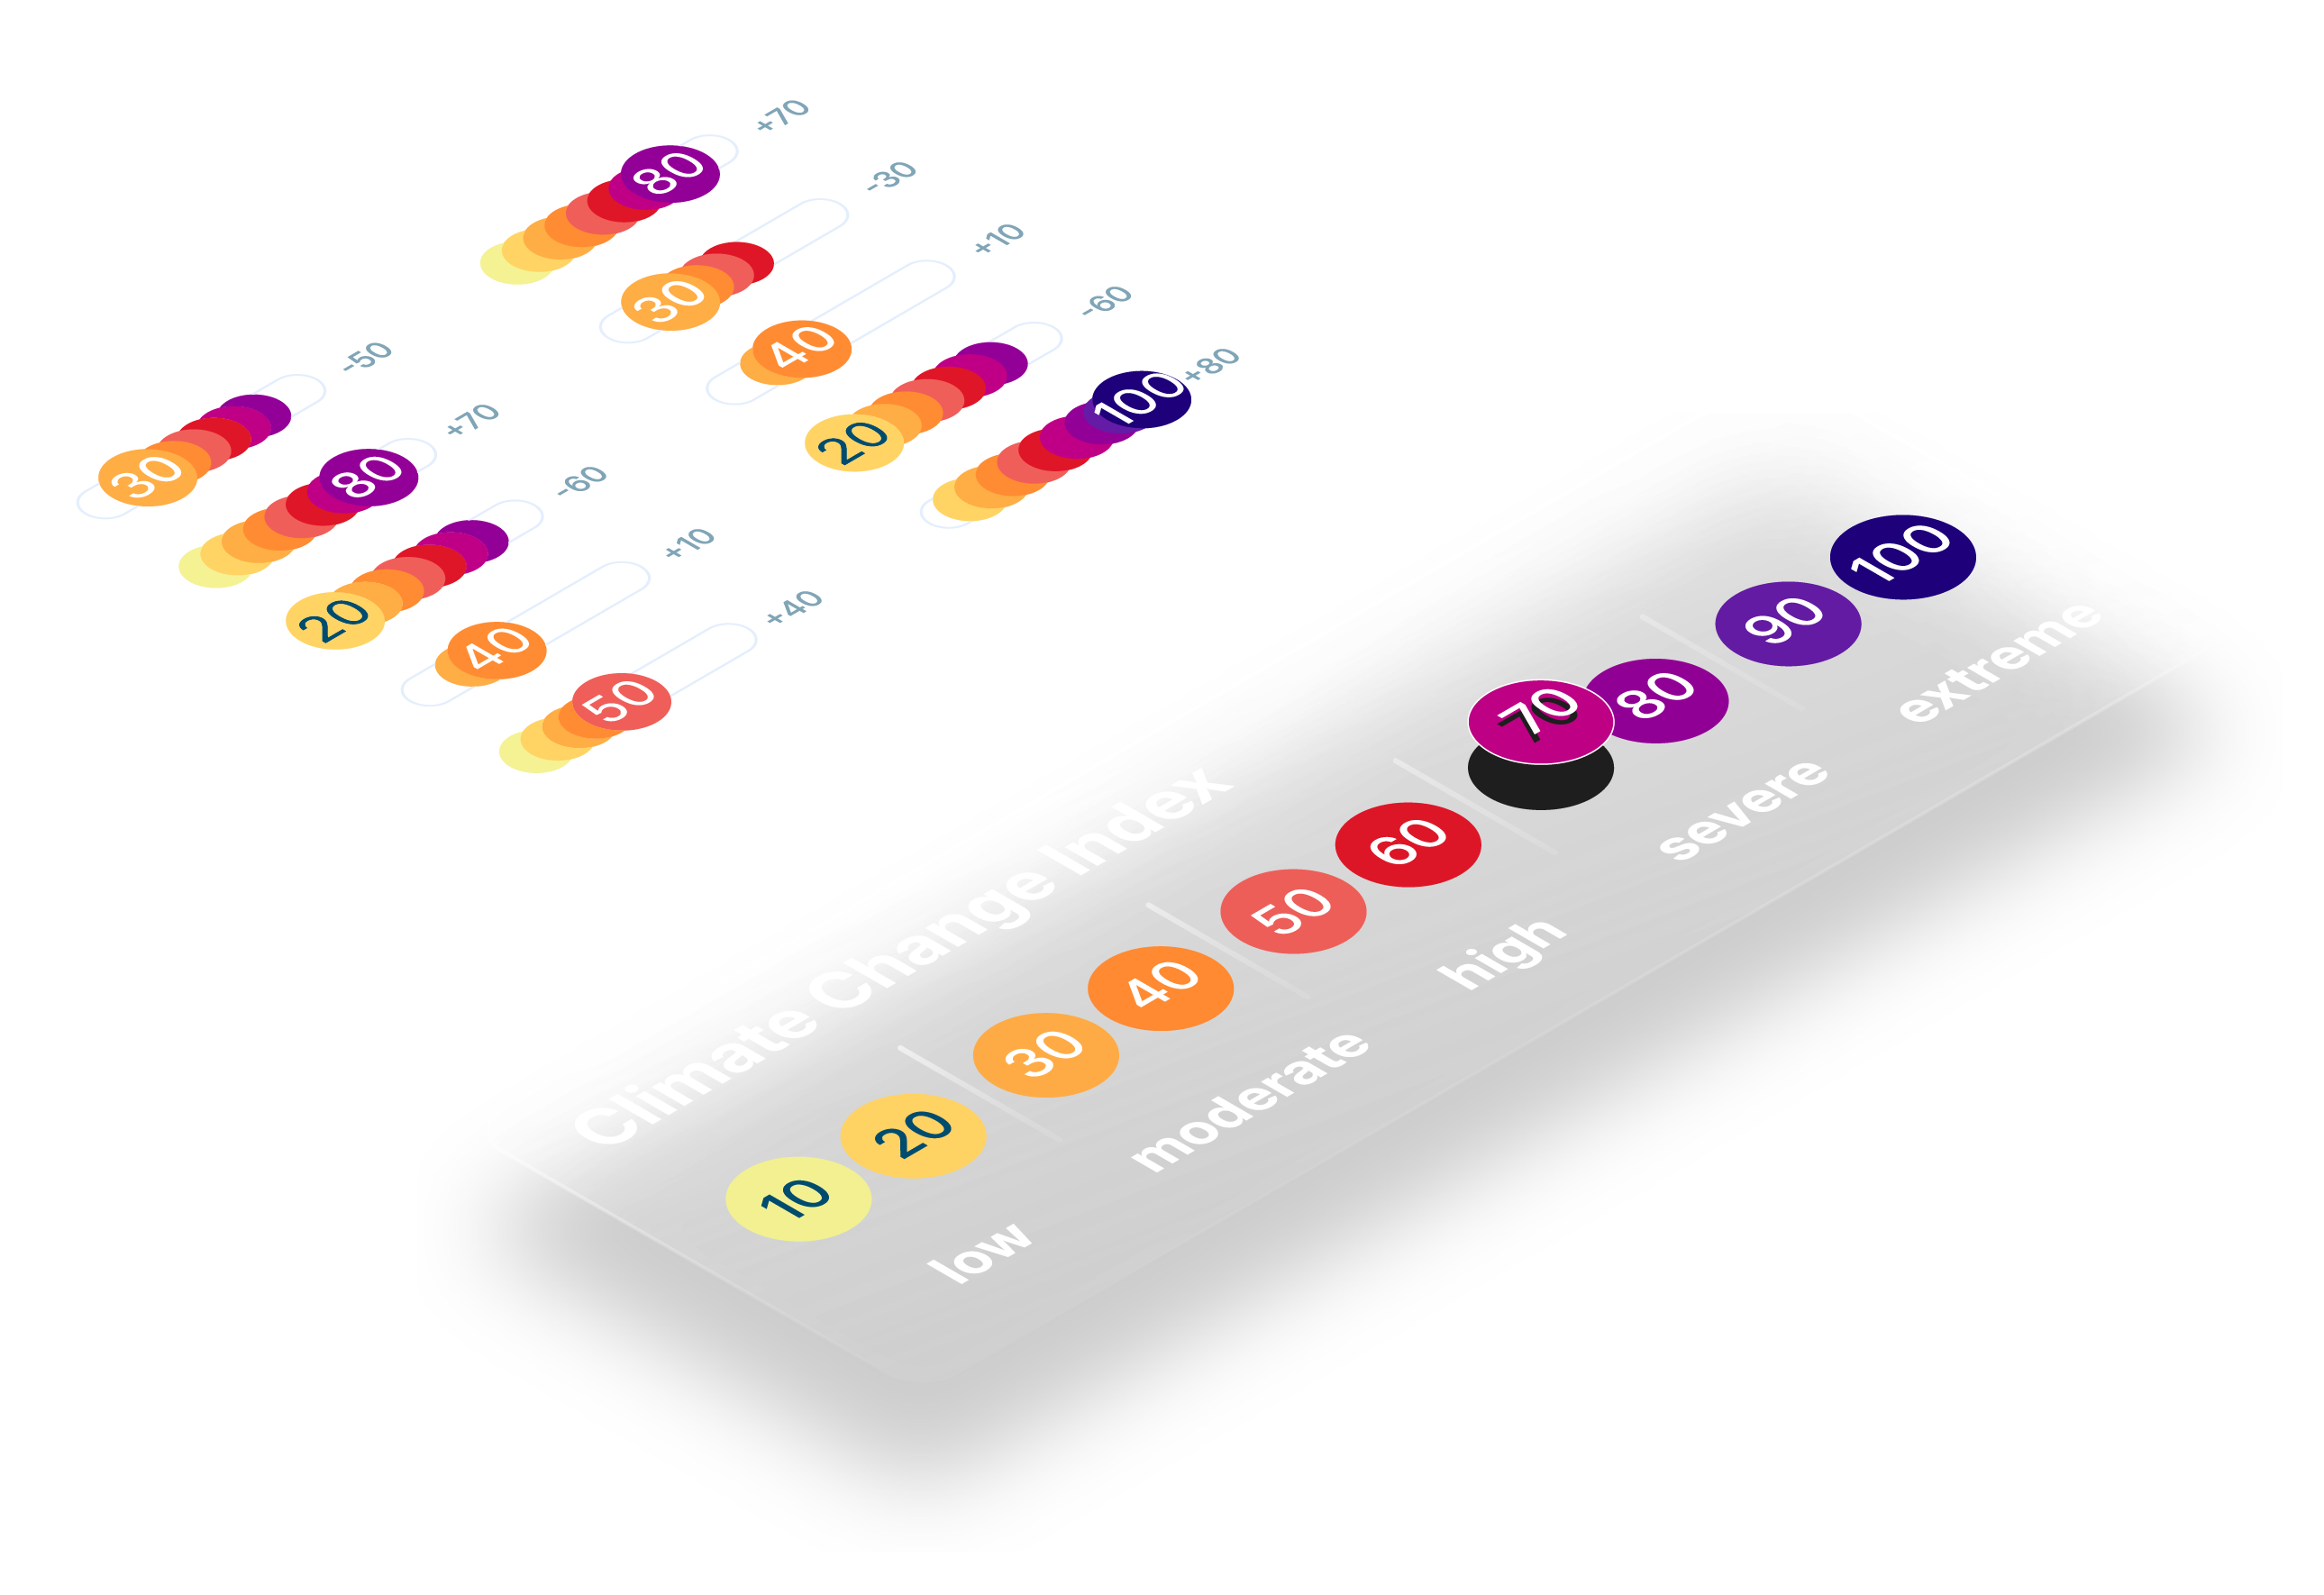
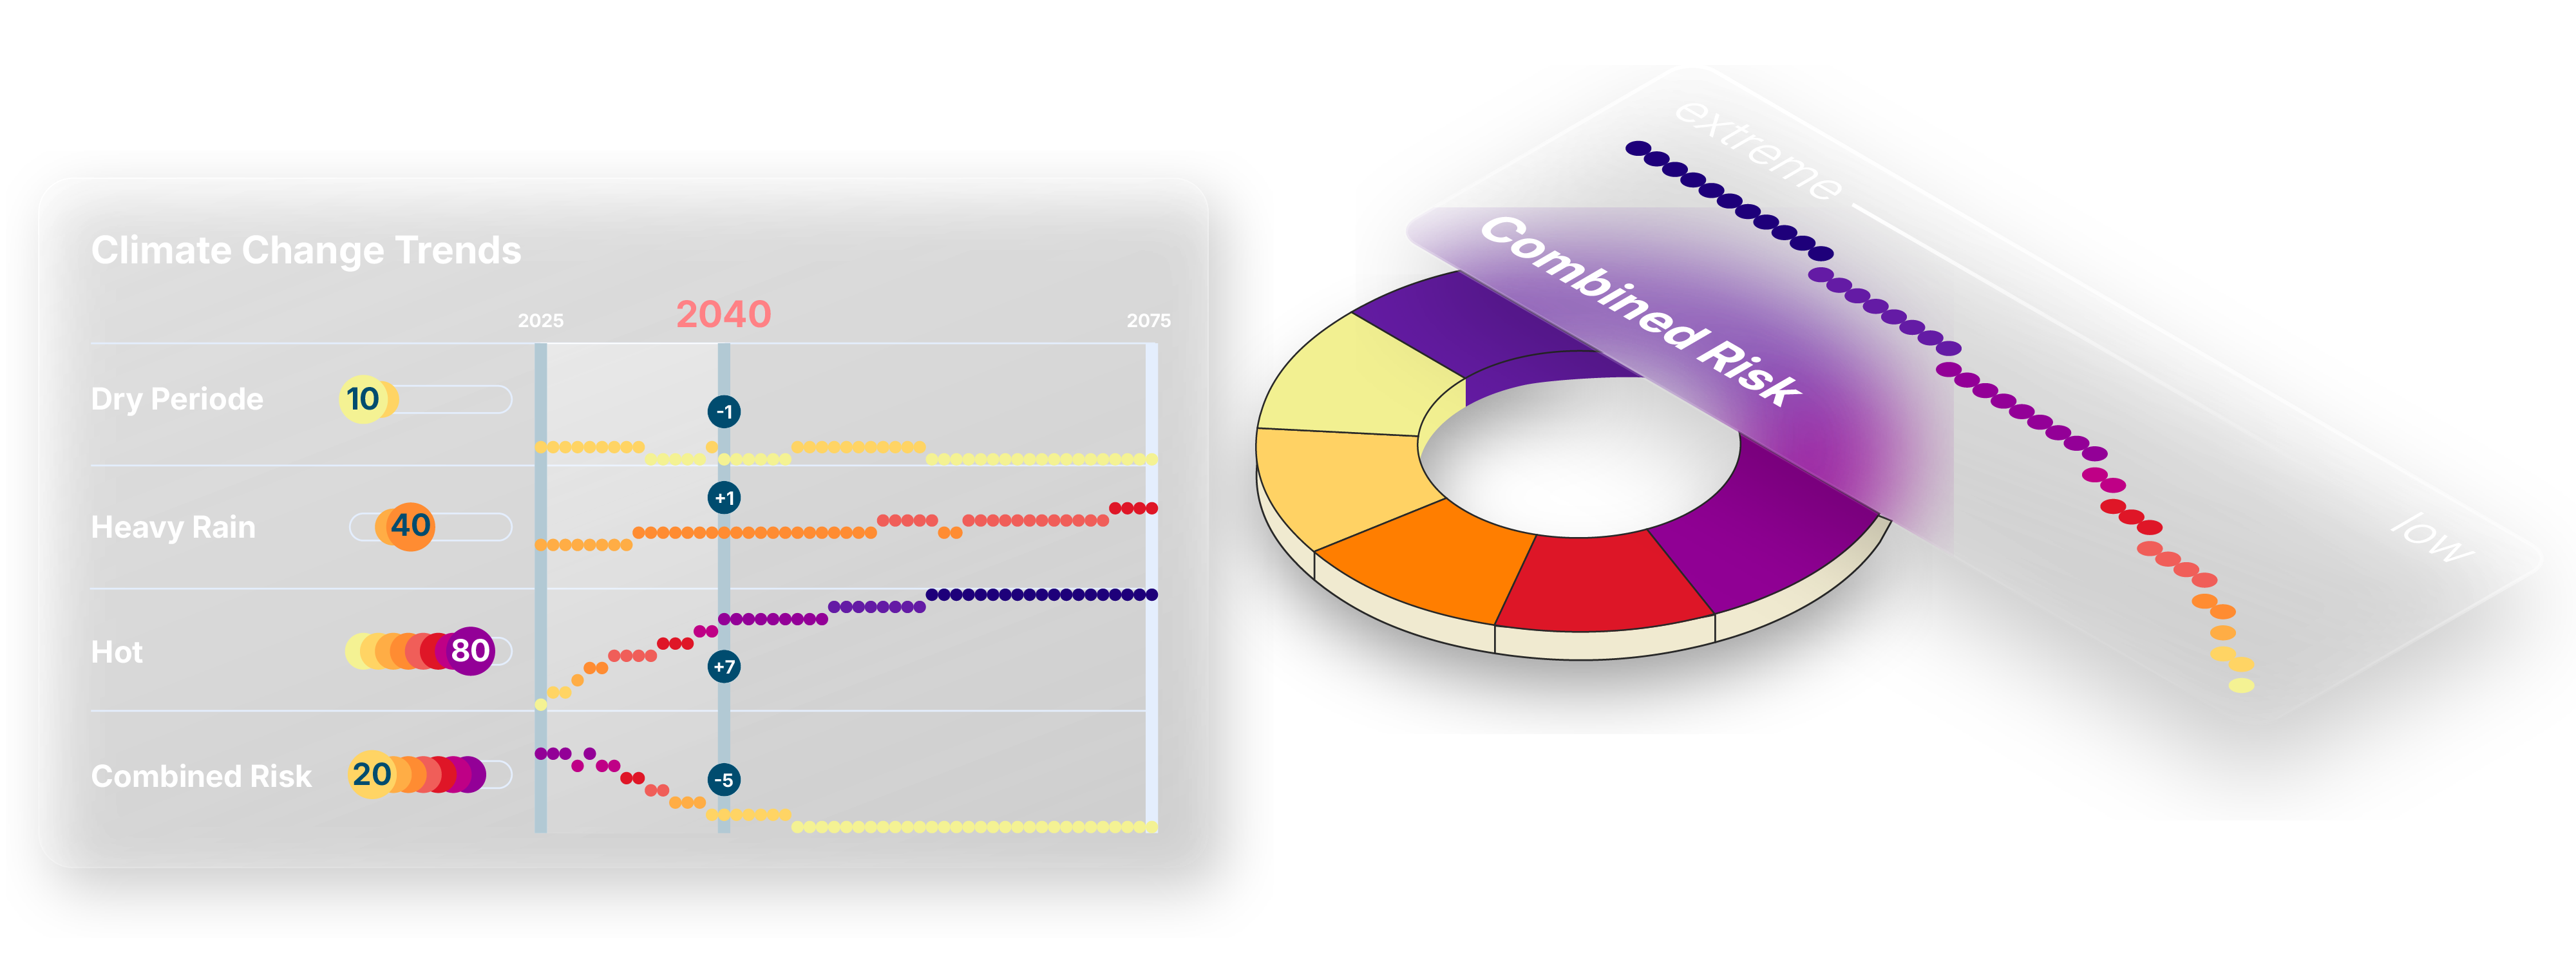
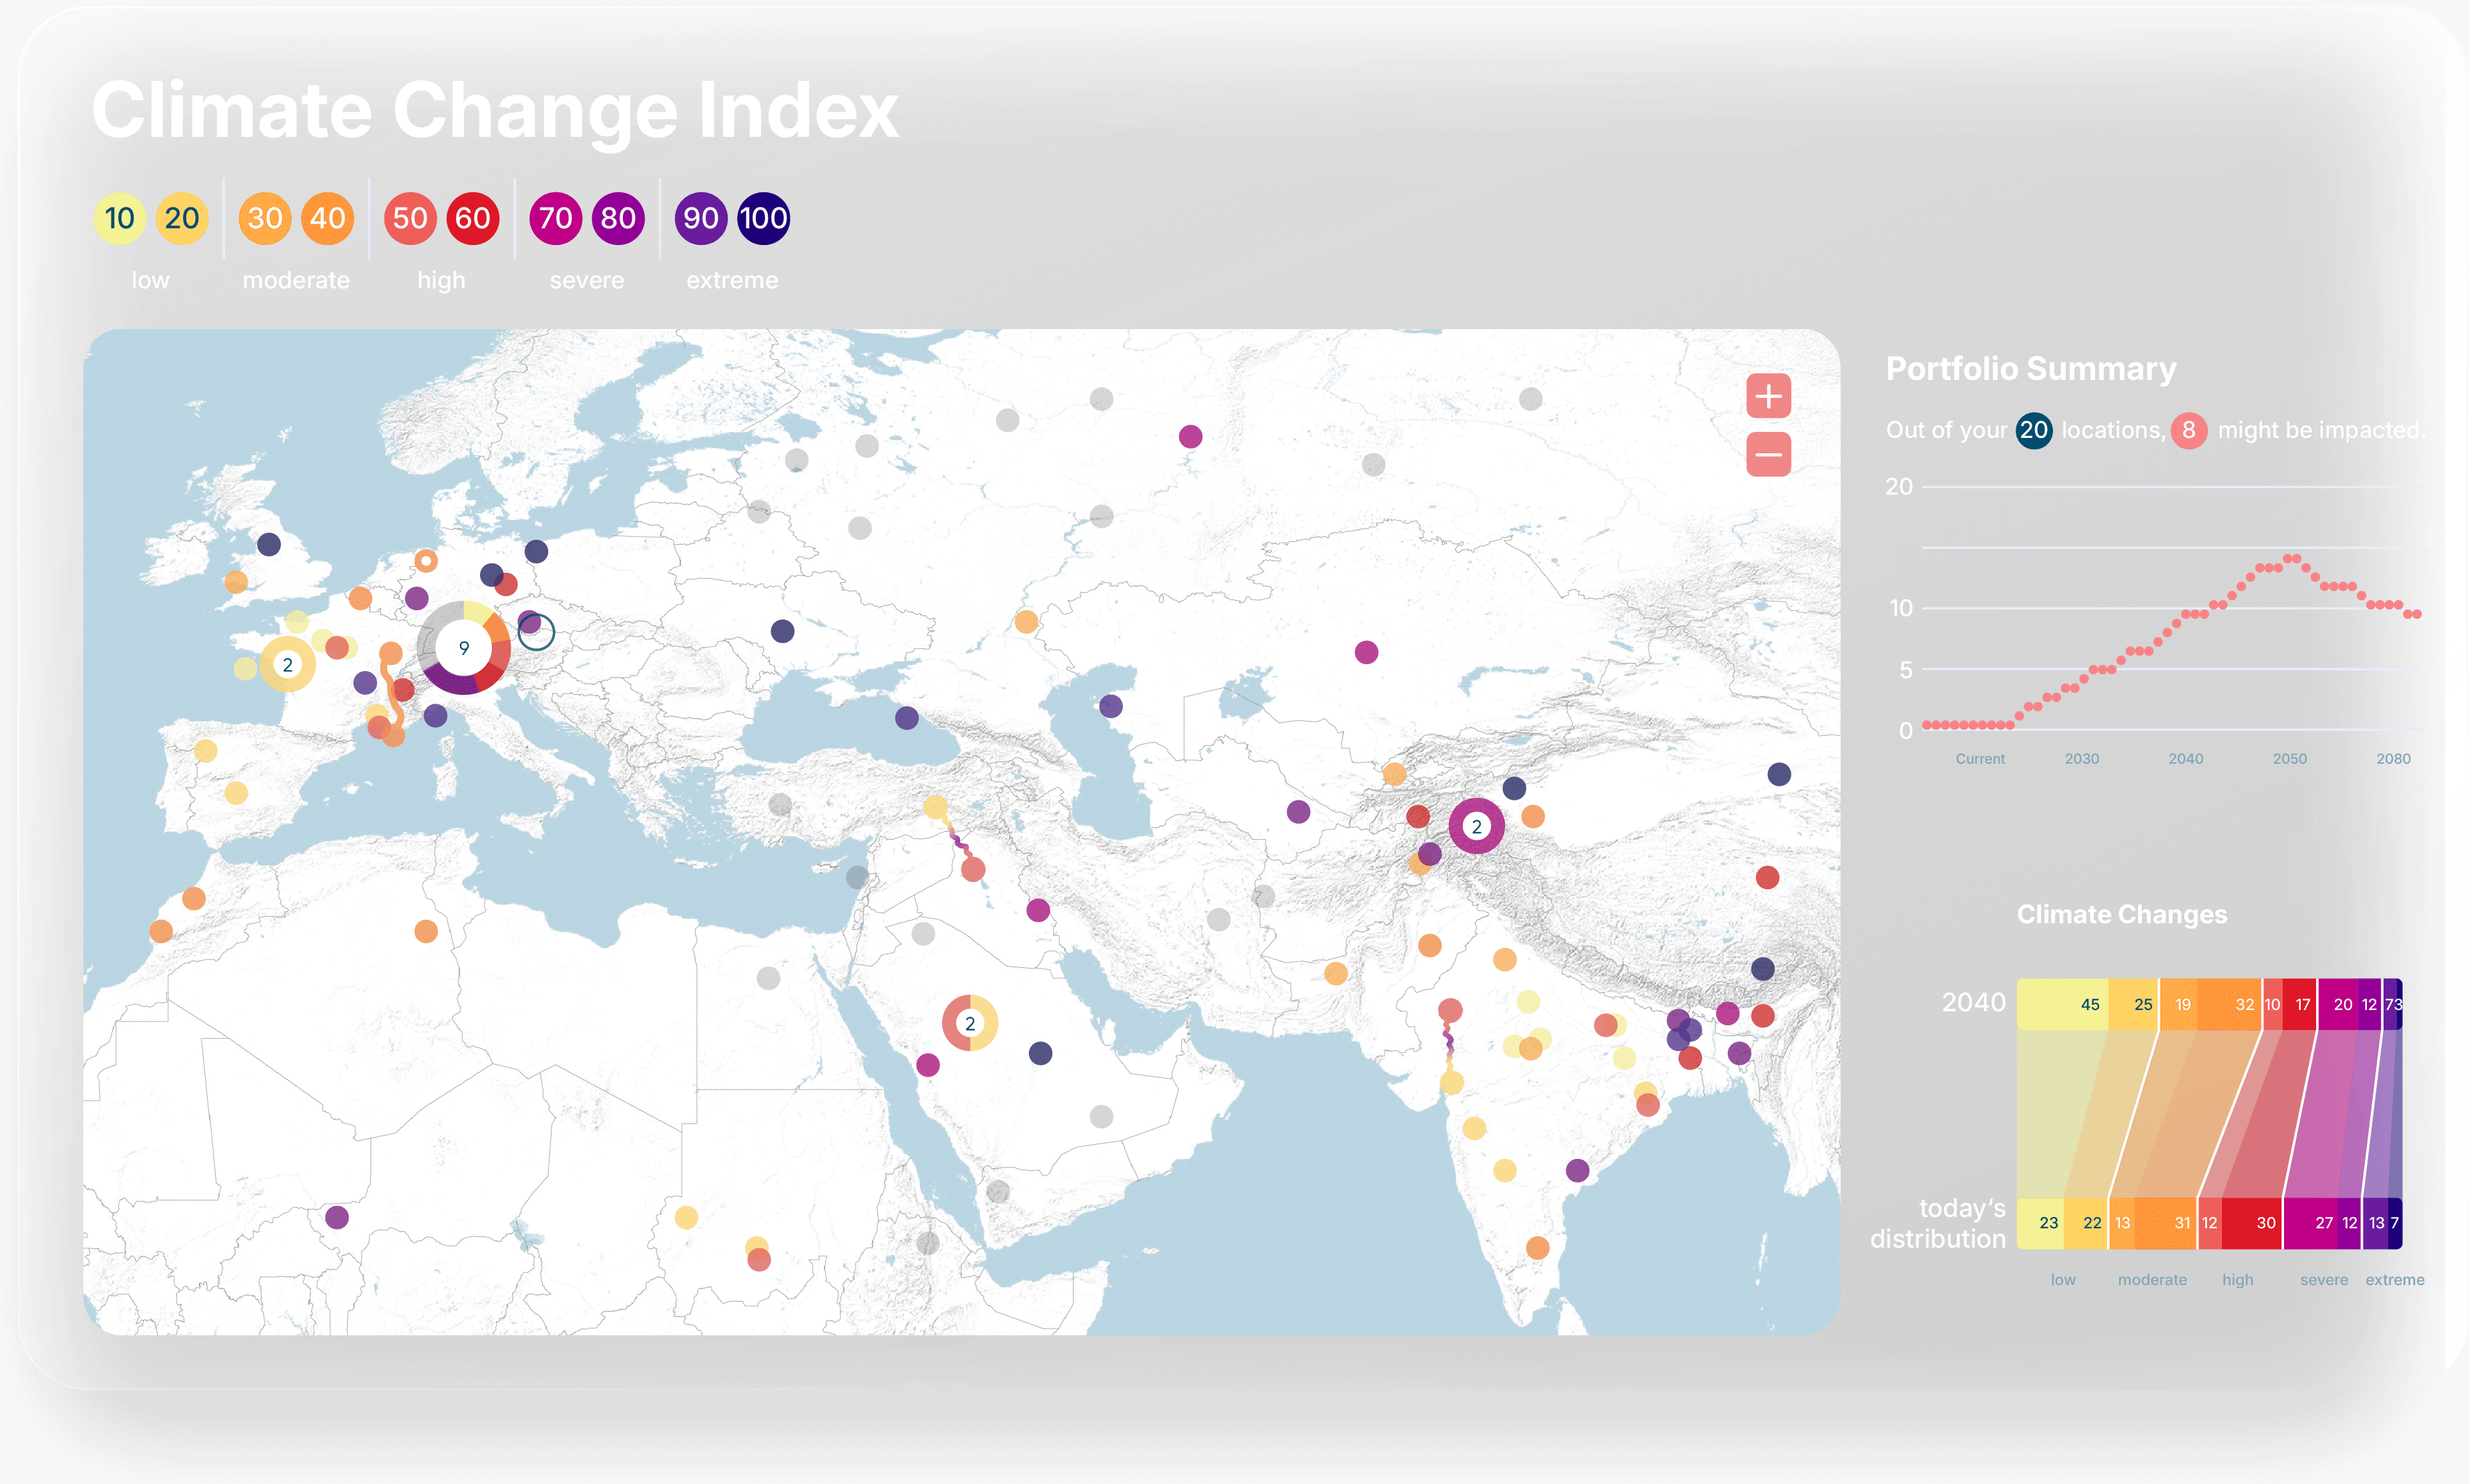
The challenge was to translate highly complex climate risk data into an intuitive experience. Where data is often intimidating, our redesign converts it into a foundation for strategic decision-making.

Client: repath.
Agency: Studio Askja
Together with: Katharina Stipp, Dirk Aschoff
Goal: Giving data a face – that was the mission.
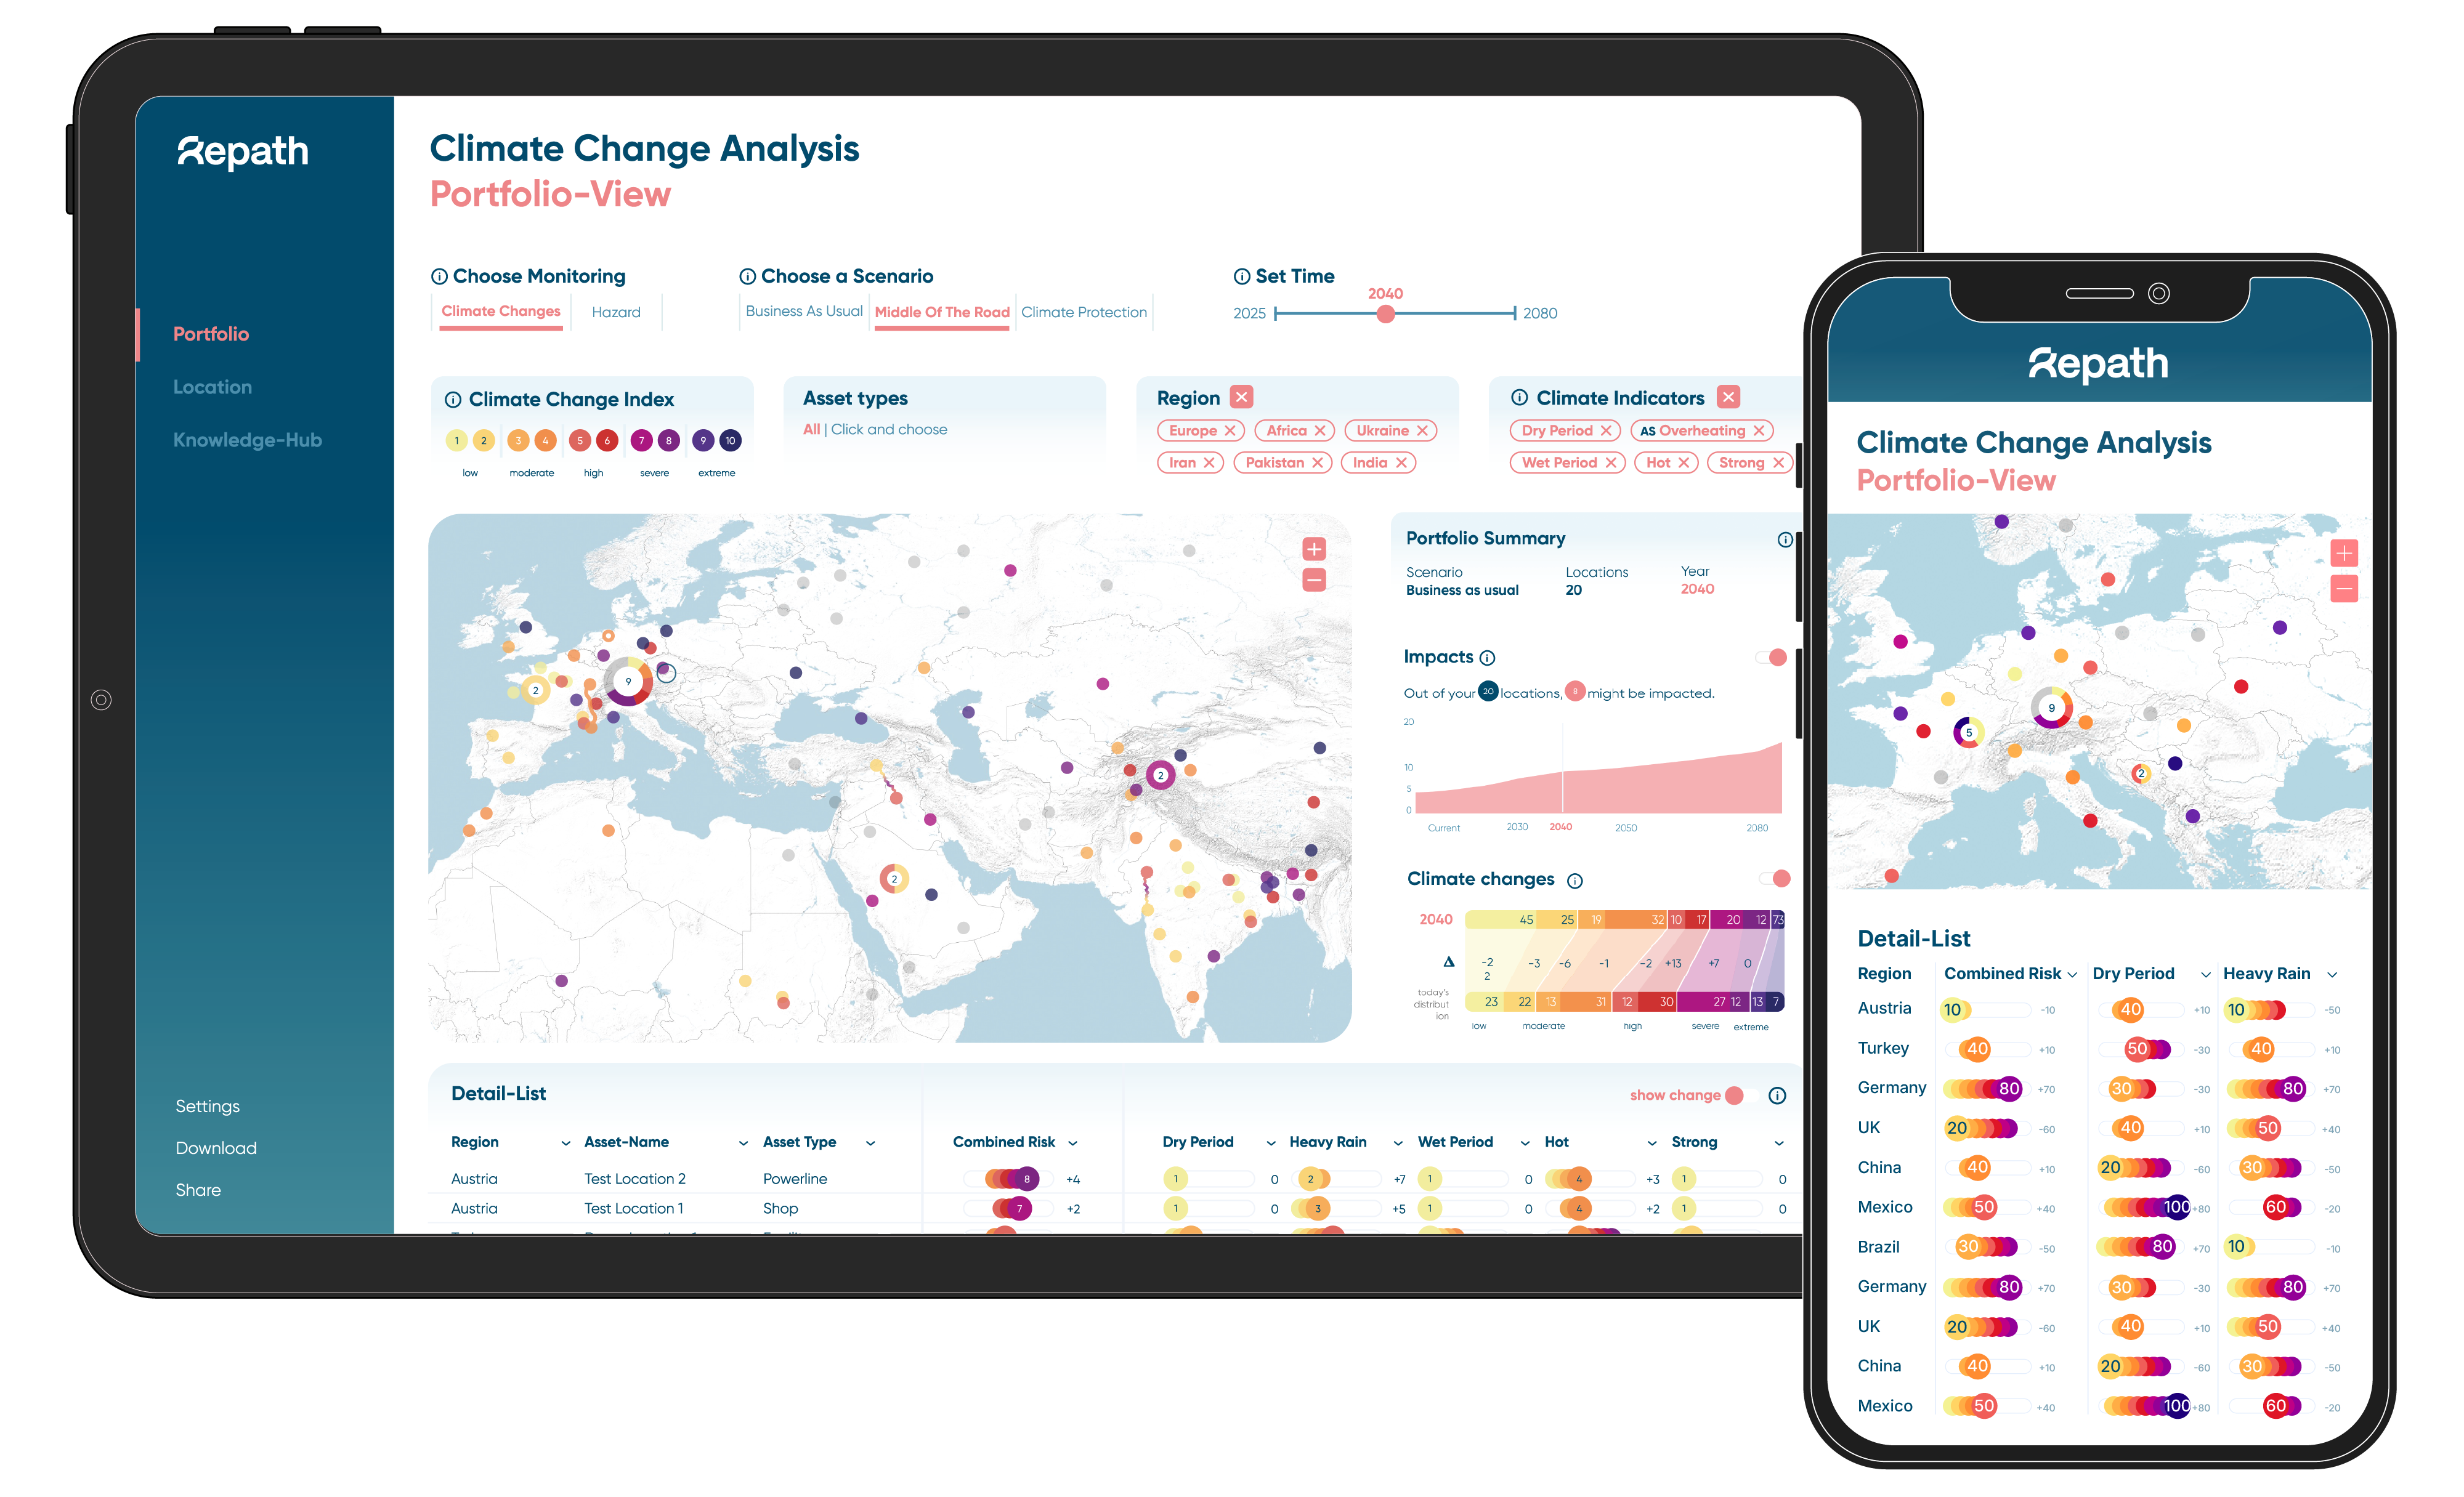
How we got there: With the new design, complex climate data becomes a tool that helps companies make the right decisions today for tomorrow.
Our focus was on bringing repath's vision - making data tangible - to life, both visually and functionally. We designed the user interface to ensure the user isn't overwhelmed by numbers. Through a clear information hierarchy, the most critical risks become instantly recognizable. Here, data is not just a mere statistic, but a point of identification for decision-makers. Data must serve the people. With a modern, fresh UI/UX concept, we created an environment where exploring one's own portfolio feels intuitive.